Digital Marketing, and the entire tech world for that matter, is moving at a fast pace. What works today may be obsolete tomorrow. Thus, we need to keep up with this fast-paced environment if we want to remain ahead of the competition. There’s no way around it.
The reason for this inspirational intro is to make way for the announcement of the death of Universal Analytics (GA3) and its rebirth as Google Analytics 4 (GA4).
It’s not the first time that this has happened, Google Analytics has had 4 big releases since its inception in 2005 and these new changes are radical enough for everyone to need to migrate to the new platform.
This post will talk about the main differences between Universal Analytics and GA4 and explain the first steps to migrate to this new platform.
However, as a commemoration of this rebirth, let’s take a brief look at the history of Google Analytics.
A Brief History of Google Analytics
2005
Google acquires Urchin Software
This is how it all started. Urchin was a web analytics company that was revolutionising the metrics world and caught Google’s attention.
Google decided to buy the company and start offering the analytics software for FREE! (back then this sounded crazy and even started some conspiracy theories about what Google was going to use the data for). You can still see a vestige of this in the UTM parameters (Urchin Tracking Module).
2007
Classic Google Analytics
Soon after Google purchased Urchin’s software it started to do what Google does best; improve the hell out of it. By 2007 they had enhanced the reporting interface and data display. Essentially making it easier to use, allowing not-techies to understand analytics. As a result the first big upgrade and migration happened.
While Urchin tags still worked, Google encouraged users to move to this new and improved version.
They started with a synchronous tracking code, and later evolved to an asynchronous tracking code which makes for a better user experience by loading web pages faster.
2012
Universal Analytics
Google kept making constant major improvements to the Google Analytics platform and in 2012, another big update came.
As the use of mobile devices was on the rise, analytics needed a way to track users across multiple devices. So Google introduced Universal Analytics with better ways of cross-platform tracking and multi-channel reporting, allowing data to be collected from practically any device connected to the internet. This version also introduced custom dimensions and custom metrics. As well as the User-ID view to track users’ cross-device.
Finally, all of the different tags used by Classic Analytics to send data to were unified into the Global Site Tag.
However, this upgrade was quite simple as the data model remained virtually untouched..
2020
Google Analytics 4
Fast forward to 2020 and GA4 was introduced with even better ways of measuring across devices.
GA4 was born out of the App + Web properties as well as a mix of Firebase Analytics used for mobile app tracking.
Now with GA4, you can easily track it all from the same platform, using what are called Data Streams.
GA4 also allows you to export your data to BigQuery for free, which up until now was a paid service or only available to GA360 users. This is a big wow factor. However, you do need to have technical expertise not only to export the data but then to manipulate it and get the information you require.
For the time being Universal Analytics properties are still available, but Google has announced that all standard Universal Analytics properties will stop processing new hits on July 1, 2023. Therefore, this will be known as the fourth big upgrade or migration. Hence the name “Google Analytics 4” or “GA4”.
Universal Analytics vs Google Analytics 4
Now that we have gone over a brief history of Google Analytics and understand that updates are part of any great software and that sometimes migrations are necessary. Let’s take a close look at what is changing in Google Analytics.
First, your Google Analytics account will remain the same, the main change is occurring at a property level.
Properties are the place where data gets processed and the entire data processing model has changed. Hence the reason that you need a migration.
Remember, as of this moment, you can have a UA property and GA4 property tracking the same site, called “Parallel tracking” and it’s what we have been recommending our clients to do as soon as possible.
However, by July 1, 2023, all the UA properties will be discontinued and will no longer process “hits” (data) being sent to them.
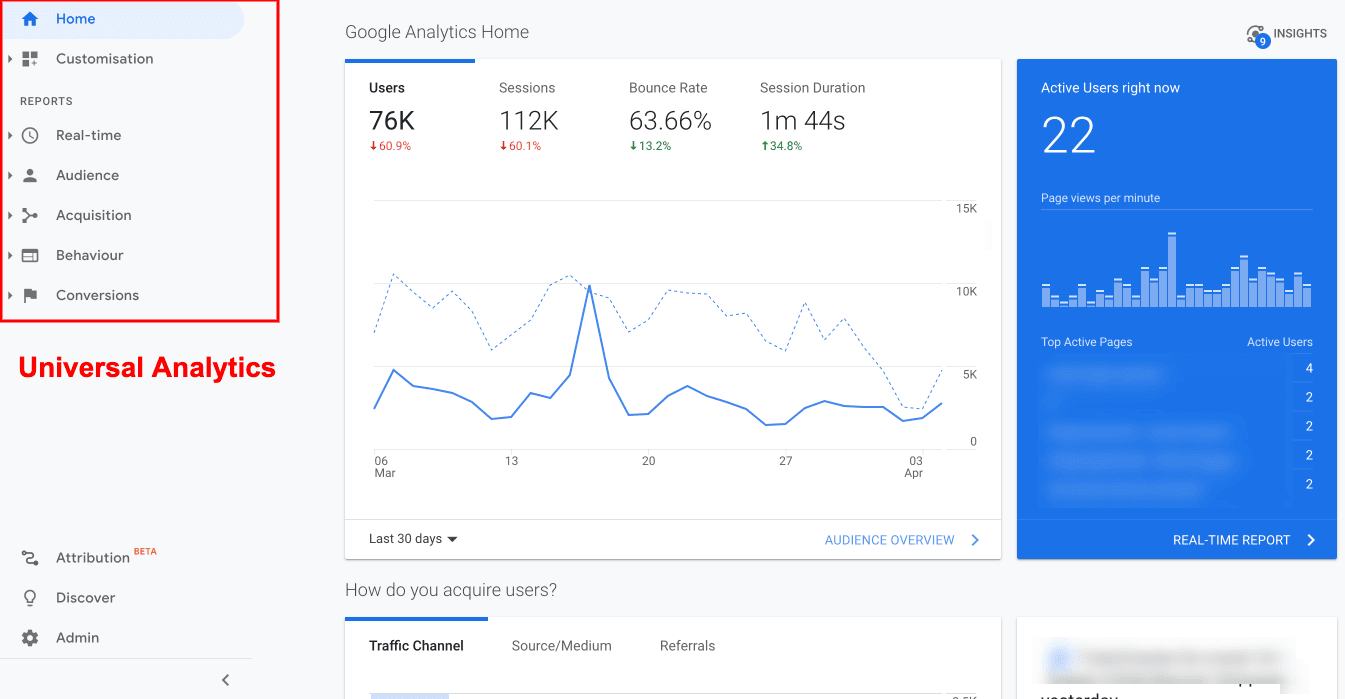
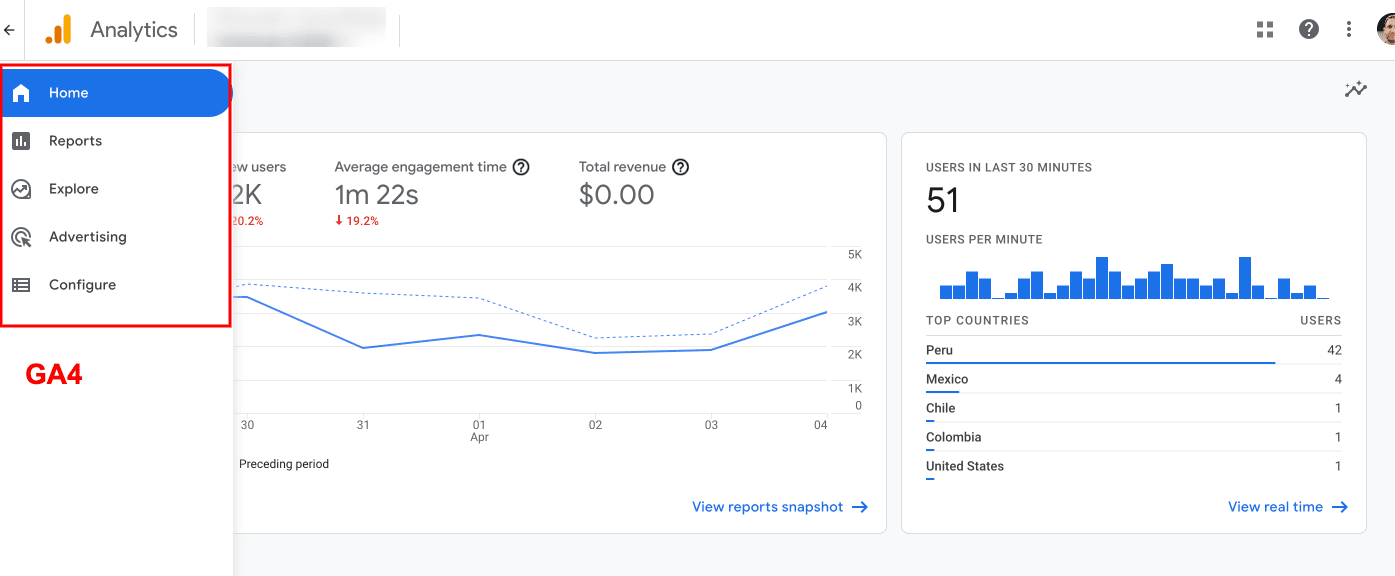
The following image shows two different properties tracking the same web page.
So what has been improved or changed in this new type of property?
The most important improvements are:
- GA4 properties can now have multiple data streams (inputs) and unify it in a single report.
- GA4 allows for easier reporting across devices making it easy to see the full customer journey.
- The data model has changed to an event based model
- GA4 is more privacy focused and future proof.
- GA4 data can be exported to Big Query for free!
- Reporting is more flexible, but can lead to being more complex.
These improvements come from the way in which GA4 collects and processes data, so let’s dive into that
Data Processing: Session-Based vs Event-Based
Session-Based, The Old Way
Universal Analytics organised the data of the users who visited our website based on their sessions.
A session in Universal Analytics is defined as a period of user activity not interrupted by more than 30 minutes. During any given session the user’s interactions are grouped into “hits”.
A hit is any user interaction that is recorded within the website. For example:
- a page view, which is fired any time a user sees (loads) a page.
- a click on a button
- a form submission
- an ecommerce purchase
- etc.
So when a user lands on your website, a page view hit would kick start their session. Then each interaction that generated a hit would keep the session active. If the user stops interacting with the website after 30 minutes and no longer sends any hits, then their session would cease.
For example, a user could be viewing your site and then is interrupted by a phone call, for just over 30 minutes. Then their session would stop. If they interacted with your site again on the same device then they would generate a new session.
This can sometimes make data interpretation a little tricky. As users can have several sessions.
Event-Based, The New way
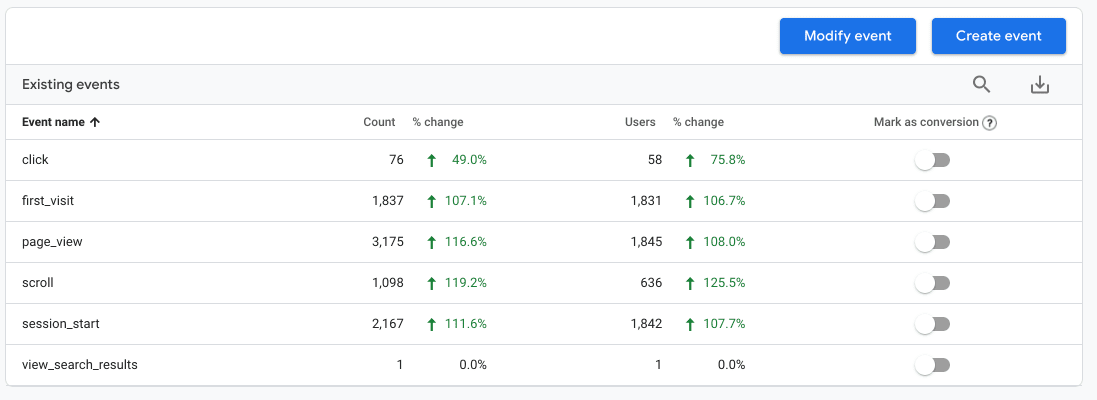
In GA4 every interaction is recorded as an event, there are no distinctions between types of hits or interactions. They are all Events now.
If someone sees one of our pages, a page_view event is triggered, if someone clicks on something a click event is triggered. This requires us to think about our data collection and tracking differently.
By default, GA4 comes with the most common type of events preconfigured. You can modify these events or create new events and adapt them to your digital marketing strategy.
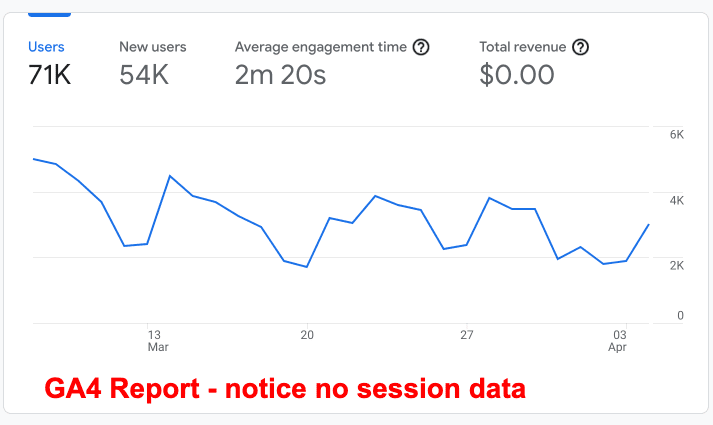
So What About Sessions?
However, sessions still exist, they are just measured in a different and more efficient way.
Universal Analytics’ rule of a 30 minute period of inactivity or having another hit resetting the session made it kind of tricky to interpret the data in a lot of instances. Also, sessions would break if campaign information changed or if by any chance midnight arrived.
GA4 still has a default timeout of 30 minutes, just like UA, and you can also modify the session length just as you could in Universal Analytics.
So how is it different? Well, in GA4 a session starts when the session_start event is triggered, which is done automatically, and the duration of the session would be the time between that first event and the last event in the session.
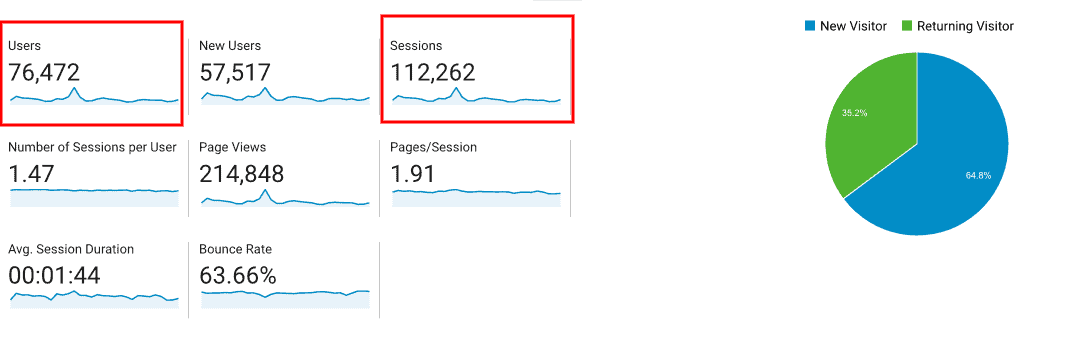
Another important metric that has changed in GA4 is Bounce Rate.
Bounce Rate vs Engaged Sessions
Bounce rate could be considered an important session-based metric in Universal Analytics.
A bounce refers to a user that lands on a page of your website and starts a session. However, then they don’t do any further interactions on your site. So a bounced session is a session with a single page view.
We personally have never considered it an important metric, as it really depends on what type of information you are providing on your website and how you measure different interactions.
For instance, if you were providing a Help resource you may want a high bounce rate, as that would mean that users are finding the content they need quickly and then leaving your site.
If your site was more lead generation site, you may want to consider a bounce rate of around 50 to 60% showing better user engagement.
However, all of this is very relative as it depends on the type of product that you are selling. Some high ticket products usually have a higher consideration time. Therefore, there is no right or wrong answer.
Another example of bounce rate could be if you have a long blog post that is 2,000 words long and includes a 10-minute video, which you are not individually tracking as an event.
A user may land on this article, watch the whole video, read the entire thing, fall in love with your brand and bookmark your website for future reference, and this still would be counted as a bounced session, if you weren’t tracking the video views or scrolling on the page.
As you can see, this is kind of unfair and doesn’t really reflect what happened if you didn’t track the other events.
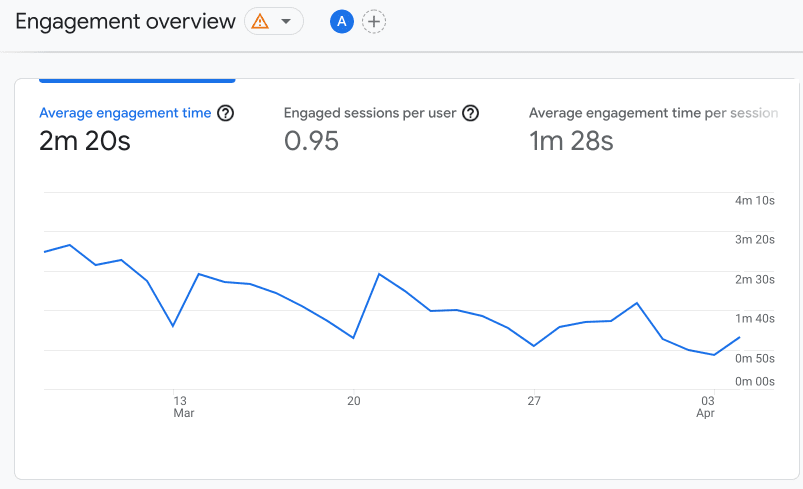
So how is this tracked in GA4? Well, GA4 has a “sessions” metric and an “engaged sessions” metric.
The engaged_session event is triggered when a user sees more than one page or spends 10 seconds or more on our site (this is customizable up to 60 seconds).
So this makes a little more justice to our last example. For instance if we have customised our engaged session event to fire after 60 seconds, we would know that person stayed on the site for at least that amount of time.
Conversely, if someone lands on our site, doesn’t find it interesting, and bounces in 5 seconds, the engaged_session event wouldn’t be triggered. Which would let us know that the user didn’t really find the article useful or interesting.
What happened to Views in GA4?
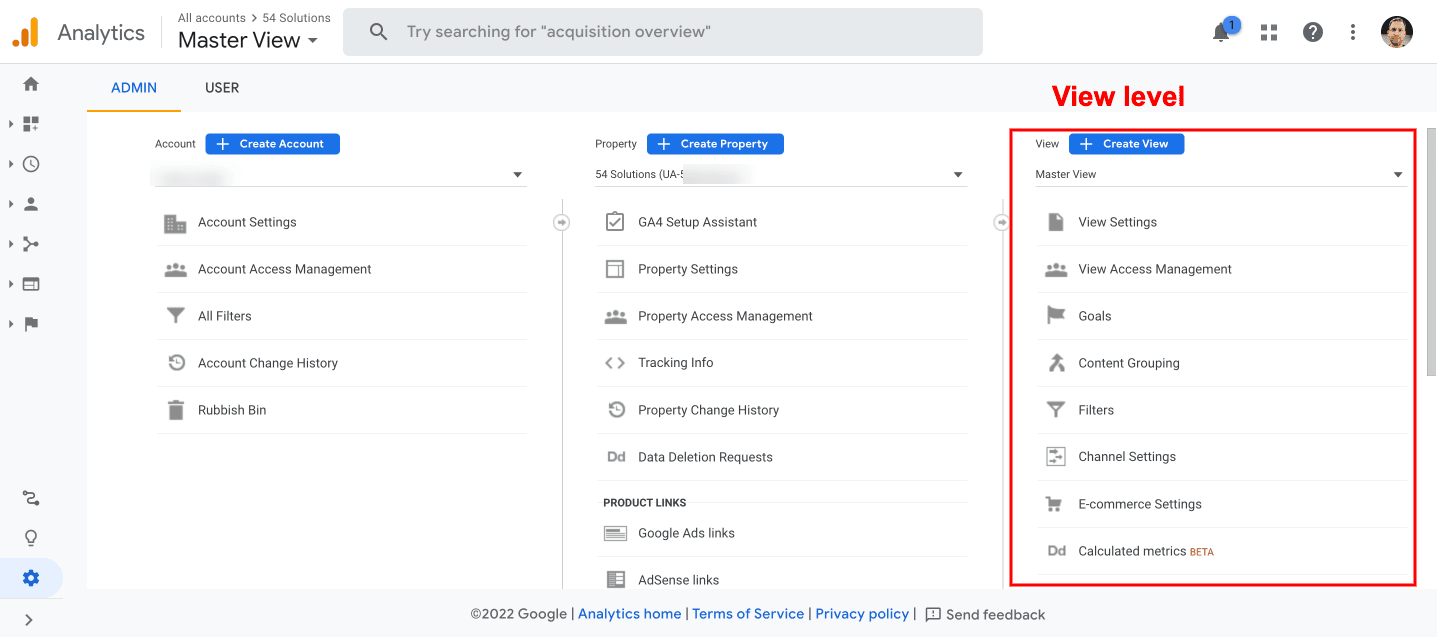
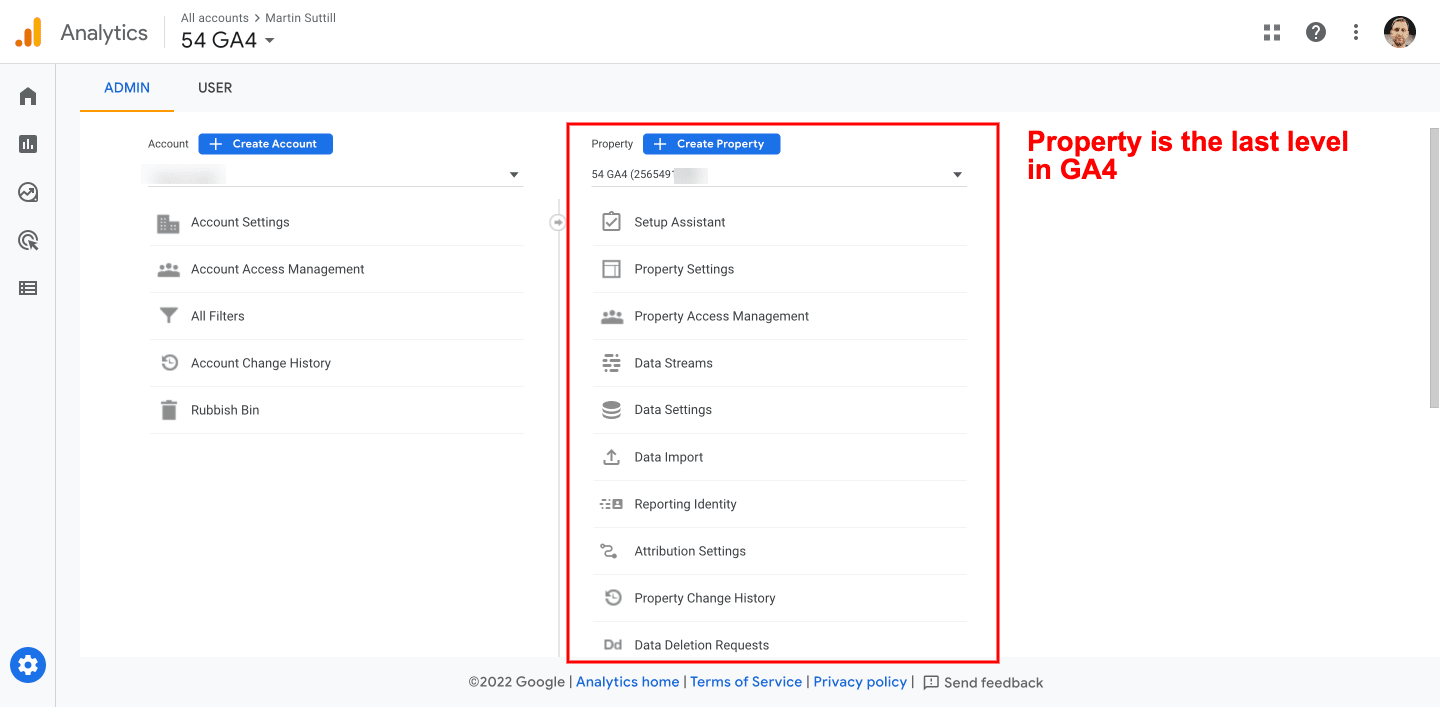
The first thing you may notice once you open a GA4 property is that the structure has changed from being Account, Property, View to just Account and Property.
So what happened to views? As we have been saying, GA4 is now more efficient. You can achieve the same thing you did with views but with different reporting tools.
So let’s begin with a quick explanation of what views are in Universal Analytics.
A view is simply the raw data from your website filtered in ways that make it easier to interpret.
For example, you could have a view just for:
- Logged in users to your site.
- Excluding internal traffic.
- Looking at users that navigate a specific sub-domain.
- Unifying certain pages.
- Filtering out query strings for easier page view reporting.
- Filtering out bots.
However, the problem with views was that once the data was filtered out you could not recuperate that data in that view for your reports. That’s where Segmentation comes into play, as segments only modified your data whilst they segments were applied. That’s another post in itself.
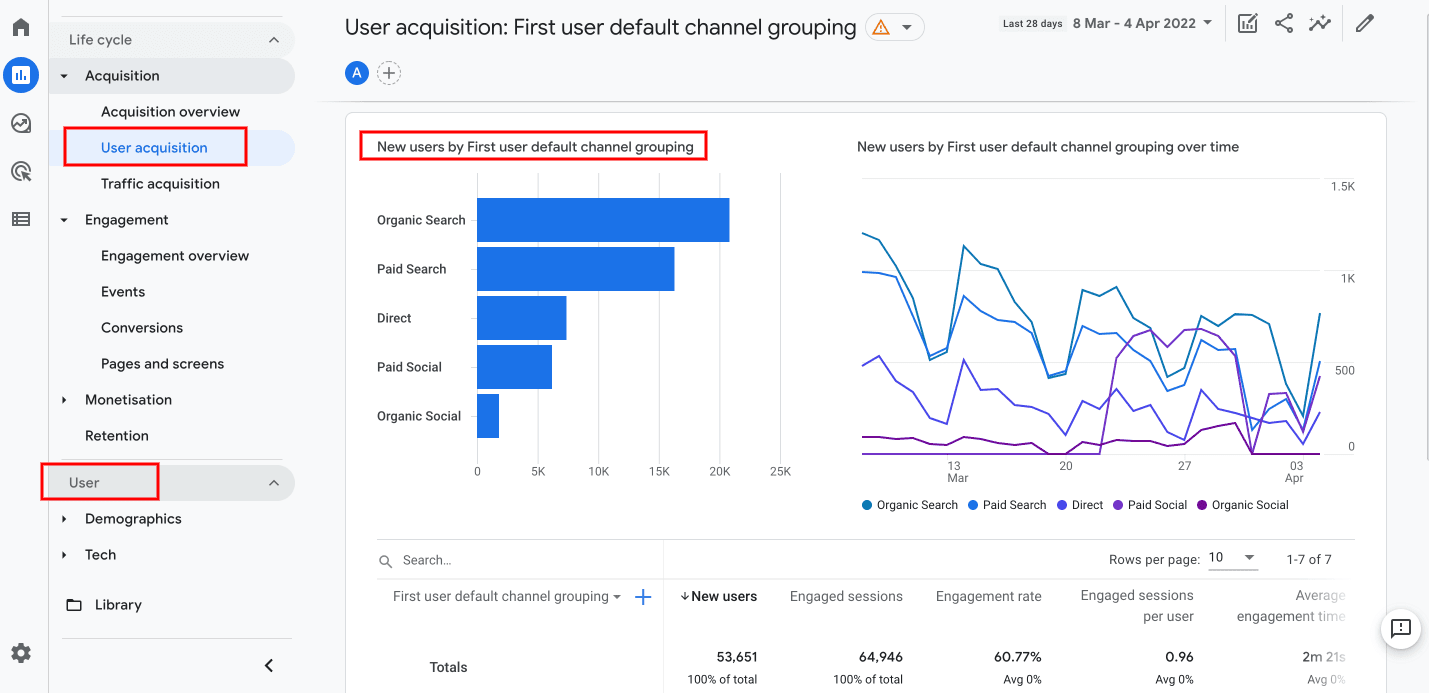
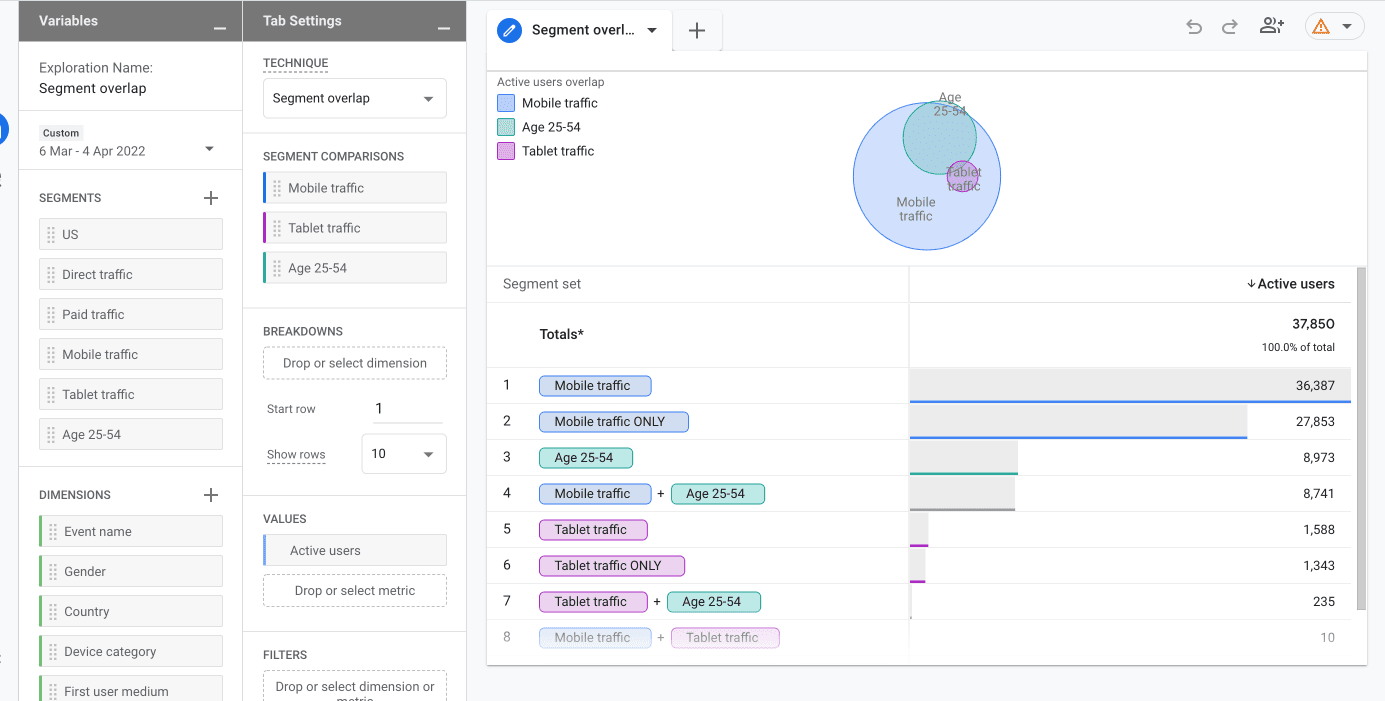
So how are we going to segment our data now in GA4, or create reports similar to our views. The answer lies in “Explorations”; a robust free form reporting tool introduced with GA4.
The tool was originally named “Analysis Hub”, which is basically what it is. A place to analyse your data more profoundly.
So “Explorations” allow you to segment your data in many different ways so you can make better sense of it.
GA4 includes some predefined exploration templates to get you started and help you understand how the tool works.
Segmenting Data
Segmentation is critical to data analysis. Segments are defined as a subset of our data, and it can be as simple as separating users by country or you can create a complex segment based on the specific behaviour of your users.
If you don’t segment your data then you are basically treating all users the same which is usually incorrect.
In Universal Analytics you were able to create up to 4 segments, either based on Users, Sessions and Behaviour. These segments would remain in place whilst you navigate through the different reports.
In GA4 you need to create a report in the Explorations tool and in there you can create the custom segments that you want.
The difference between GA4 and UA is that you can create up to 10 segments per exploration vs 4 segments in UA.
Segmented data is also sampled (in UA too), but the sample size used is 100,000,000 rows.
Also in GA4, besides User and Session segments, you are also able to create Event Segments. Here we will explain the different types of segments available.
User Segments
If a user matches certain criteria, all of the events of this user will be included in the segment. If for example, a user that matches the criteria had two different sessions, the events in both sessions would be included in the segment.
Examples of this could be:
- users who added items to their shopping baskets, but didn’t complete their purchase.
- users who viewed particular pages on your site.
Session Segments
If a session matches certain criteria, all of the events of this session will be included in the segment. If a user had two sessions but only one of them matched the criteria, only that session’s events will be included.
Examples of this could be:
- all the sessions that originated from a specific advertising campaign
- all the sessions that ended in a specific conversion, such as lead generation form.
Event Segments
Event Segments show only particular events that match the criteria.
Examples of this could be:
- all purchase events that happened in a particular location.
- Specific page_view events that happened using a specific browser or device type.
The New GA4 Interface & Reports
So, Now What?
Universal Analytics Is Being Shut down
Migrating to Google Analytics 4 is a must if you want to keep using a free analytics tool.
You will be able to analyse past data in Universal Analytics but only for six months, according to Google. Therefore it’s really important to start building data in GA4 as soon as possible. We suggest running parallel tracking.
At 54 Solutions we can help you migrate your tracking from Universal Analytics to GA4.